Rapidly explore and generate insights in minutes.
Upload your data, let the AI summarize what matters, and get a confidence-ready insight to start a conversation. No dashboards, plugins, or SQL required!
No credit card required. Includes 3 free insights to use within 7 days.
How does it work?
We check structure, headers, and basic consistency, then keep signed-in uploads in your private workspace so you can reuse them later.
AI reads distributions, trends, and anomalies in clear language so you can make sense of the numbers fast.
Receive a concise insight report you can copy, download, or act on without reinventing the wheel.
What you’ll get (with examples)
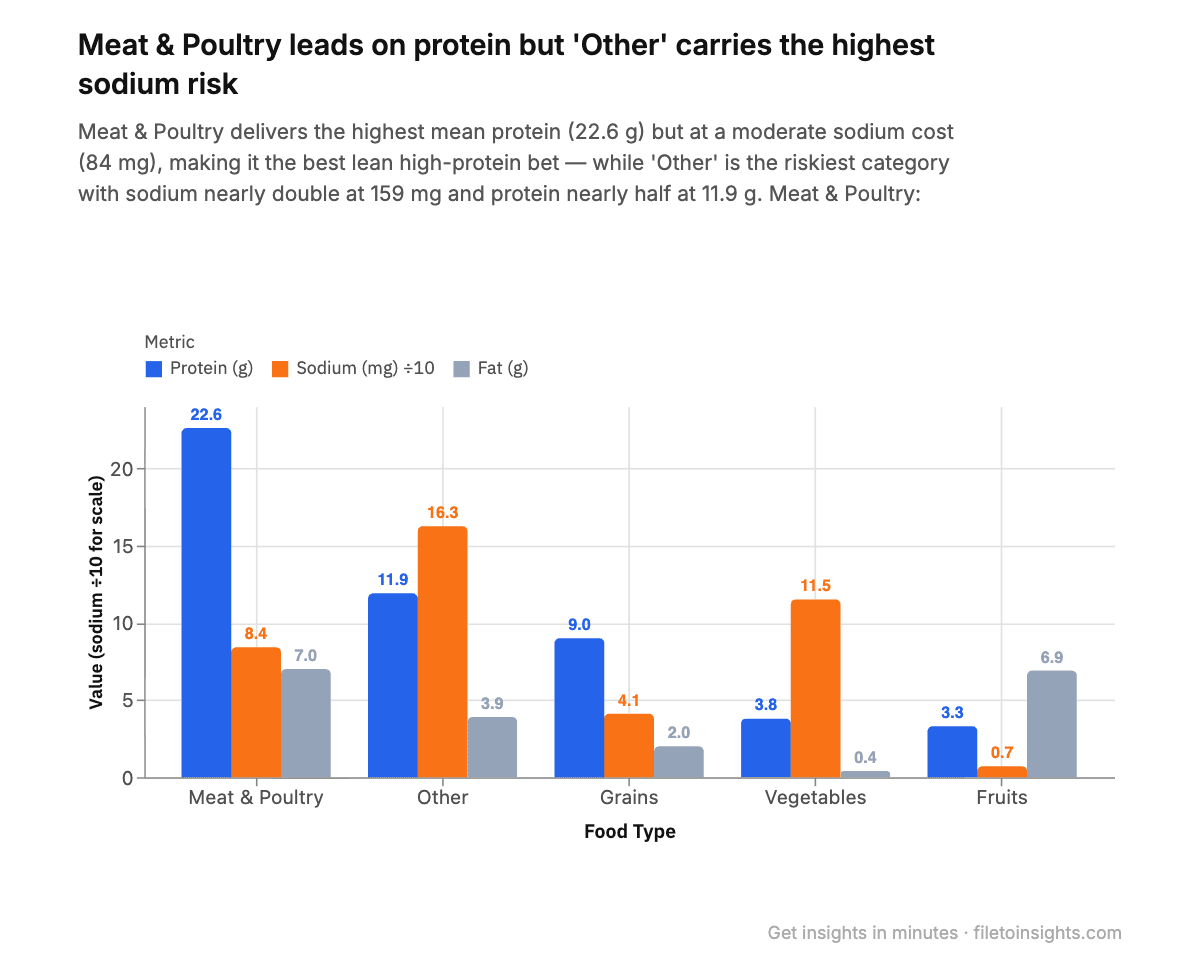
Healthy Foods Database
Stacked horizontal bar chart revealing how Snacks & Sweets dominate calorie and fat loads while Grains and Vegetables lead on health score.
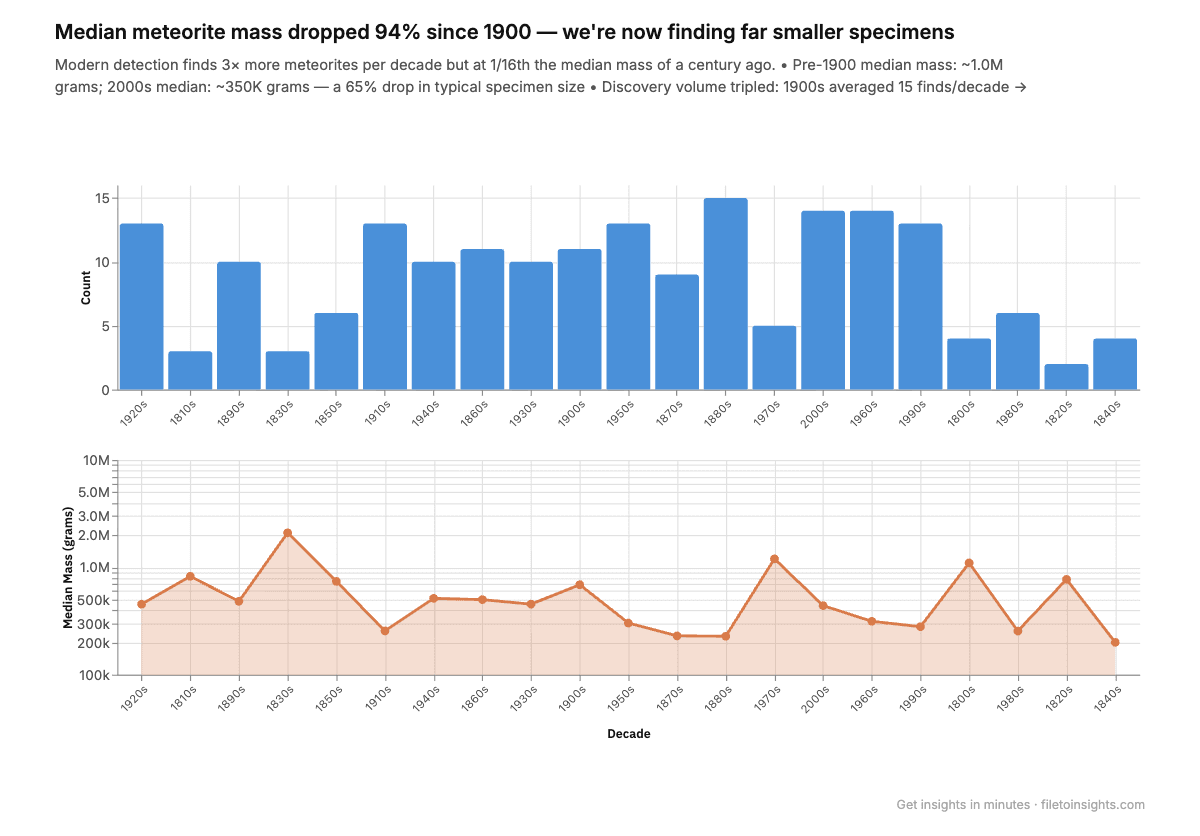
Meteor Strikes
Dual-panel chart showing how modern detection finds far more meteorites per decade — but at dramatically smaller median masses than a century ago.
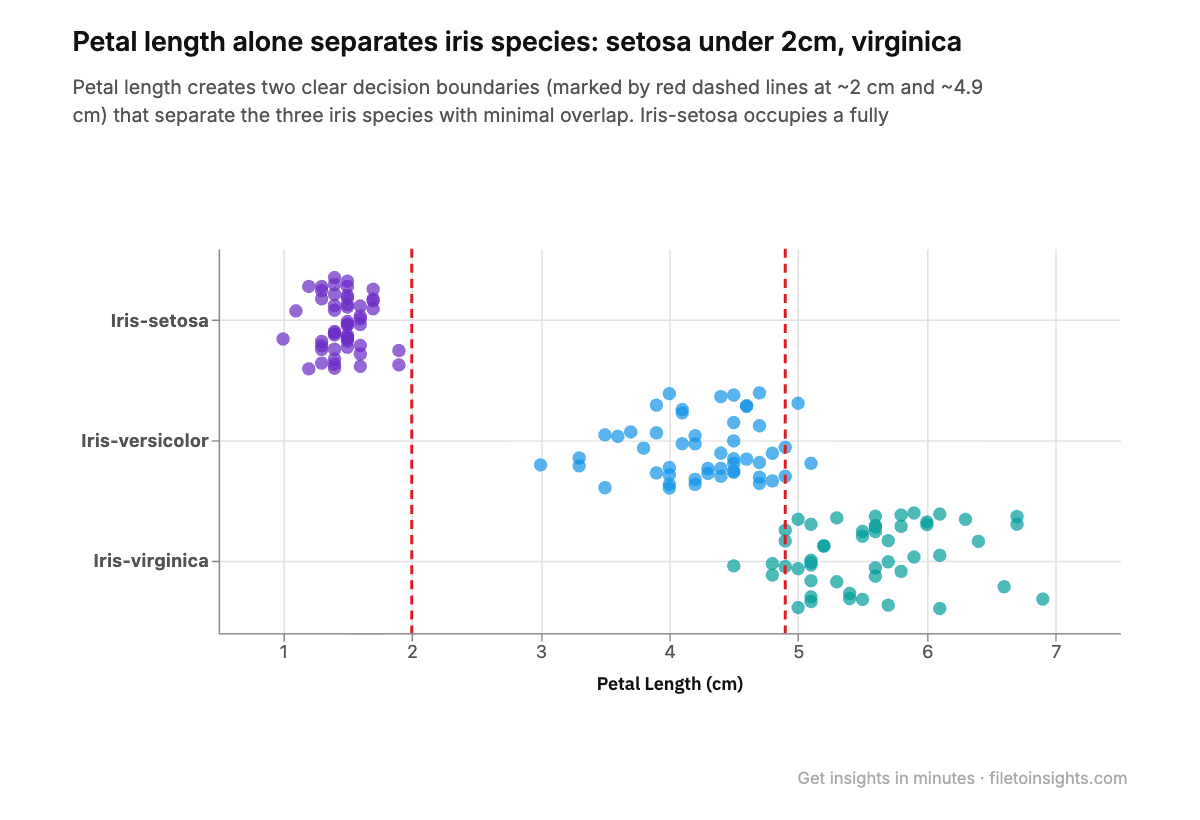
Iris Flower Clusters
Strip plot with species rows and two dashed decision boundaries showing how petal length alone separates all three iris species.
- A plain-language summary of the dataset
- Key observations and patterns unlocked instantly
- Notable anomalies or signals flagged for review
- Practical implications and caveats to guide decisions
These outputs were generated and refined directly in the app. Replicate them with your own file.
This tool highlights patterns, but it is not a replacement for formal statistical analysis.
What problems this tries to solve
You don’t know where to start
Opening a dataset is easy. Knowing what to look for isn’t.
- What the data is
- What stands out
- Why it matters
So you’re never staring at a spreadsheet wondering “now what?”
You don’t want to fight tools just to explore data
Most data tools require:
- setup and configuration
- chart decisions upfront
- learning tool-specific constraints
Here, you focus on questions and meaning, not tooling friction. The system handles sensible defaults, and you refine only when needed.
You need fast turnaround, not a perfect dashboard
This tool is optimized for:
- exploration
- early insights
- communication
It’s ideal when you want to:
- understand a dataset quickly
- share findings with others
- decide what’s worth deeper analysis later